파이썬 코드로 Diagram을 그릴 수 있는 Packge를 찾다가 좋은 것을 찾았습니다.
회로도, Flowchart, Timming 등 상당히 많은 것을 그릴 수 있습니다.

schemdraw
Schemdraw documentation — SchemDraw 0.15 documentation
Schemdraw documentation — SchemDraw 0.15 documentation
schemdraw.readthedocs.io
만약 'AttributeError: 'Text' object has no property 'math_fontfamily' 에러가 발생하다면 다음을 참고 바랍니다.
[파이썬] matplotlib의 math_fontfamily 에러 (tistory.com)
[파이썬] matplotlib의 math_fontfamily 에러
다음과 같이 plot에서 math_fontfamily 를 사용하니 에러가 발생합니다. ax.text(1, 7, msg, size=12, math_fontfamily='cm') Math fontfamily — Matplotlib 3.5.3 documentation Math fontfamily — Matplot..
question99.tistory.com
몇 가지 기본적인 코드로 어떤 것을 할 수 있는지 가능성을 보겠습니다.
회로도의 저항을 그려 봅니다. 대략적인 사용 방법을 알 수 있습니다.
########################################
#  기본적인 Circuit draw : 저항 그리기
########################################
import schemdraw
import schemdraw.elements as elm

with schemdraw.Drawing() as d:
    d += elm.Resistor().right().label('1Ω')
저항, 콘덴서, 다이오드를 그립니다.
#########################################################
#  기본적인 Circuit draw : 저항, 콘덴서, 다이오드 그리기
#########################################################
import schemdraw
import schemdraw.elements as elm

with schemdraw.Drawing() as d:
    d.add(elm.Resistor())
    d.add(elm.Capacitor())
    d.add(elm.Diode())
전자 소자를 사용해서 회로도를 그립니다.
###################################################################
#  기본적인 Circuit draw : 저항, 콘덴서, 전원을 사용한 회로 연결
###################################################################
import schemdraw
from schemdraw import flow

with schemdraw.Drawing() as d:
    d += elm.Resistor()
    d += elm.Capacitor().down()
    d += elm.Line().left()
    d += elm.Ground()
    d += elm.SourceV().up()
    d.draw()
    d.save('schem_ex01.svg')
소자의 용량 Text를 쓸 수 있습니다.
############################################################################
#  기본적인 Circuit draw : 저항, 콘덴서, 전원을 사용한 회로 연결(용량 표시)
############################################################################
import schemdraw
from schemdraw import flow

with schemdraw.Drawing() as d:
    d += elm.Resistor().label('100KΩ')
    d += elm.Capacitor().down().label('0.1μF', loc='bottom')
    d += elm.Line().left()
    d += elm.Ground()
    d += elm.SourceV().up().label('10V')
플로우차트(Flowchart)를 그립니다.
############################
#  기본적인 Flowchart draw
############################
import schemdraw
from schemdraw import flow

with schemdraw.Drawing() as d:
    d += flow.Start().label('START')
    d += flow.Arrow()
    d += flow.Box(label='Box')
    d += flow.Arrow().down(d.unit/3)       # down(d.unit/3) 과 같이 사용해서 Arrow를 짧게 만듭니다
    d += flow.Box(label='Box')
    d += flow.Arrow().down(d.unit/3)
    d += flow.Start().label('END')
아래와 같이 여러가지를 그릴 수 있습니다.
with schemdraw.Drawing() as d:
    d += (A := flow.State().label('A').at((1.5, 3)))
    d += (B := flow.State().label('B').at((0, 0)))
    d += (C := flow.State().label('C').at((3, 0)))
    d += (D := flow.State().label('D').at((8, 2)))

    d += elm.Arc2(arrow='>', k=.4).at(A.E).to(C.N).color('red').label('AC')
    d += elm.ArcZ(arrow='<>').at(C.E).to(D.W).color('blue').label('CD')
    d += elm.ArcN(arrow='<>').at(A.S).to(B.N).color('orange').label('AB')
    d += elm.Arc2(arrow='>', k=.5).at(C.SW).to(B.SE).color('green').label('BC')
    d += (elm.ArcLoop(radius=.75,arrow='<').at(D.NW).to(D.NE).color('purple')
          .label('TR', loc='TR').label('TL', loc='TL').label('BR', loc='BR').label('BL', loc='BL'))
import schemdraw
from schemdraw import elements as elm
from schemdraw import logic
schemdraw.use('svg')

logic.Kmap(names='AB',
           default='',
           groups={'1.': {'color': 'blue', 'fill': '#0000ff33'},
                   '..': {'color': 'purple'},
                   '.0': {'color': 'red', 'fill': '#ff000033'}},
           truthtable=[('00', '00'),
                       ('11', '11'),
                       ('01', '01'),
                       ('10', '10')])
import schemdraw
from schemdraw import elements as elm
from schemdraw import logic
schemdraw.use('svg')

def drawElements(elm_list, n=5, dx=1, dy=2, ofst=.8, fname=None, **kwargs):
    x, y = 0, 0
    d = schemdraw.Drawing(fontsize=12)
    for e in elm_list:
        element = getattr(logic, e)
        A = d.add(element, xy=[(d.unit+1)*x+1,y], toplabel=e, **kwargs)
        x = x + dx
        if x >= n:
            x=0
            y=y-dy
    return d

elist = ['And', 'Nand', 'Or', 'Nor', 'Xor', 'Xnor', 'Buf', 'Not', 'NotNot', 'Tgate',
         'Schmitt', 'SchmittNot', 'SchmittAnd', 'SchmittNand']

display(drawElements(elist, d='right'))
import schemdraw
from schemdraw import logic

schemdraw.use('svg')

# Themes and colors - using schemdraw's themeing
schemdraw.theme('oceans16')

d = schemdraw.Drawing()  # Theme applies to drawing, not to element...
d += logic.TimingDiagram.from_json('''{ signal: [
  { name: "clk",  wave: "P......" },
  { name: "bus",  wave: "x.==.=x", data: ["head", "body", "tail", "data"] },
  { name: "wire", wave: "0.1..0.", node: 'abcde'  }
]}''')
d
# Extended 'edge' notations
logic.TimingDiagram(
    {'signal': [
        {'name': 'A', 'wave': 'x3...x'},
        {'name': 'B', 'wave': 'x6.6.x'}],
     'edge': ['[0^:1]+[0^:5] $t_1$',
              '[1^:1]<->[1^:3] $t_o$',
              '[0^:3]-[1v:3]{gray,:}',
             ]},
    ygap=.5, grid=False)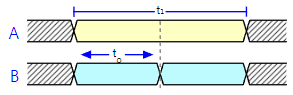
'프로그램' 카테고리의 다른 글
| [H/W] C: 드라이브 SSD 교체하기 (0) | 2022.08.14 |
|---|---|
| [H/W] HDD가 70도 열나고 속도저하-HDD복제하기 (0) | 2022.08.14 |
| [파이썬] matplotlib의 math_fontfamily 에러 (0) | 2022.08.13 |
| [파이썬] 웹에서 뉴스 데이터 가져오기 (웹크롤링) (1) | 2022.08.12 |
| [파이썬] 함수 실행시간 측정 하기 (0) | 2022.08.12 |


댓글