728x90
반응형
import pandas as pd
import matplotlib.pyplot as plt
import seaborn as sns
import warnings

warnings.filterwarnings(action='ignore')   # 경고메세지 끄기
# warnings.filterwarnings(action='default')  # 다시 출력하게 하기

# data = pd.read_csv('Daegutemp_20120101_20211231.csv', header=1,  sep=',', encoding='utf-8')
data = pd.read_csv('Daegutemp_20120101_20211231.csv', sep=',', encoding='cp949')        # 파일 읽기
# data.columns = [지점	지점명	일시	평균기온(°C)	최저기온(°C)	최고기온(°C)]
data.columns = ['no' ,'name', 't_date','avg_temp', 'low_temp', 'high_temp']              # 컬럼명 변경

data['month'] = data.t_date.astype(str).str[0:7]             # 월(yyyy-mm) 데이터 추가

idx = data['high_temp'].idxmax()              # high 온도 인덱스 찾기
high_temp = data['high_temp'][idx]            # high 온도 찾기
high_date = data['t_date'][idx]               # high 온도의 날짜

idx = data['low_temp'].idxmin()                # low 온도 인덱스 찾기
low_temp = data['low_temp'][idx]               # low 온도 찾기
low_date = data['t_date'][idx]                 # low 온도의 날짜

print(f'Highest temperature of Deagu in 2012.1.1. ~ 2021.12.31. :{high_temp} on {high_date}')
print(f'Lowest temperature of Deagu in 2012.1.1. ~ 2021.12.31. :{low_temp} on {low_date}')

plt.figure(figsize=(16,10))                     # 그래프 그리기
plt.rcParams['font.family'] = 'NanumGothic'
sns.boxplot(x="month", y="avg_temp", data=data)  # avg_temp(평균온도)로 boxplot 그래프 그리기
# plt.boxplot(x="month", y="avg_temp", data=data)  # avg_temp(평균온도)로 boxplot 그래프 그리기
plt.title("월별 기온")
plt.xlabel('month')
plt.ylabel('(°C)')
plt.xticks(rotation=45)
plt.grid()
plt.show()
결과
Highest temperature of Deagu in 2012.1.1. ~ 2021.12.31. :39.2 on 2018-07-27
Lowest temperature of Deagu in 2012.1.1. ~ 2021.12.31. :-13.9 on 2018-01-27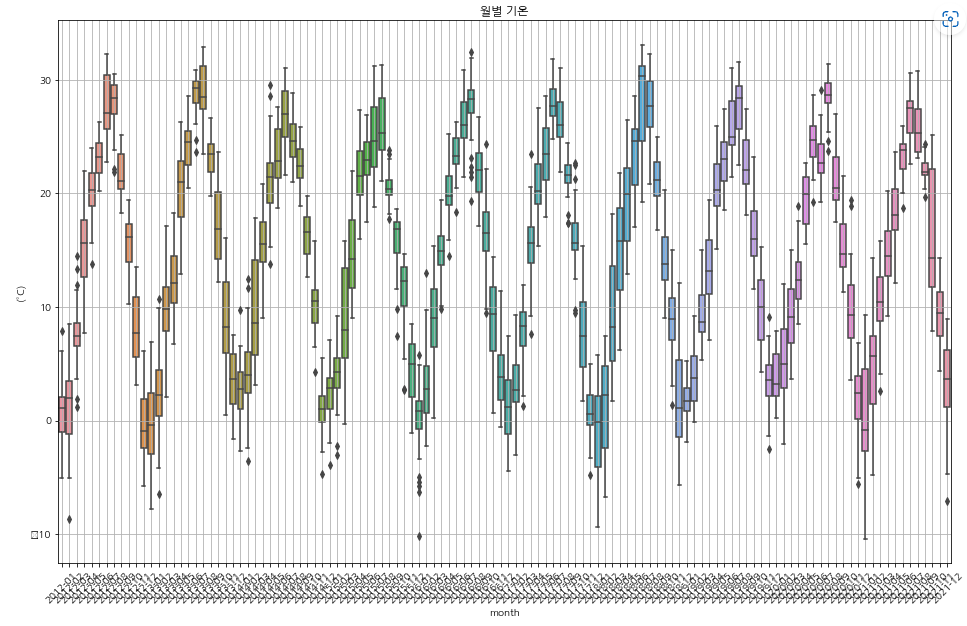
728x90
반응형
'프로그램' 카테고리의 다른 글
| [파이썬] 문제 : 두 시간의 소요시간 계산 (0) | 2022.11.02 |
|---|---|
| [파이썬] 문제 : 임의의 3개의 수중 합이 0이 되는 경우 (0) | 2022.11.02 |
| [파이썬] Data : 기상자료개발포털 (0) | 2022.11.02 |
| [파이썬] 문자열 뒤집기 (0) | 2022.11.02 |
| [파이썬] 문제 : 문자열 중 모음 Count (0) | 2022.11.02 |

댓글