728x90
반응형
import numpy as np
import matplotlib.pyplot as plt

# fig = plt.figure(1)
fig = plt.figure(figsize=(16,8))
# Get x values of the sine wave
t = np.arange(0, 5, 0.01);

ax1 = fig.add_subplot(311)
ax1.plot(t, np.sin(2*np.pi*t))
ax2 = fig.add_subplot(312)
ax2.plot(t, np.sin(4*np.pi*t))
ax3 = fig.add_subplot(313)
ax3.plot(t, np.sin(4*np.pi*t)+np.sin(2*np.pi*t))

plt.show()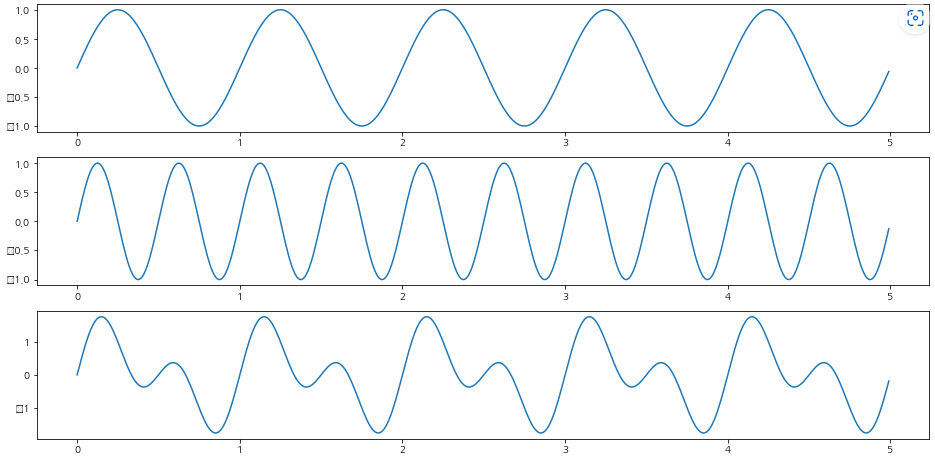
728x90
반응형
'프로그램' 카테고리의 다른 글
| [파이썬] data (winequality-white) (0) | 2022.11.01 |
|---|---|
| [파이썬] 가위바위보 게임(승부 판단 로직) (0) | 2022.11.01 |
| [파이썬] 터틀 골뱅이 그리기 (0) | 2022.10.30 |
| [파이썬] Qt5 입력 및 Label Text 변경. Button Click event (0) | 2022.10.27 |
| [파이썬] 터틀. 육각형 도형 원형으로 배열하기 (0) | 2022.10.27 |


댓글