프로그램
[파이썬] 문제 : 하나의 plot에 수십개의 데이터 그리기
오디세이99
2023. 3. 31. 19:59
728x90
반응형
(문제)
데이터가 40X256 배열의 데이터일때
[1, 1,2, 1,3, 1,1, 1,7...(256개]
,[1,1,7,1.2,2,2,1...(256개)]...[40개]
...
하나의 그래프에 1번째 값을 맨 아래에 그리고 그 위로 차례로 그림.
y축엔 50,100,150,200.. 이런식 표시.
(방법)
1번째 방법
import random
import matplotlib.pyplot as plt

data = [[random.randint(1,9) for i in range(10)] for i in range(20)]

altitude = [v for v in range(50, 50*(len(data)+1), 50)]  # 고도(50, 10, 150...) 만듬
plt_data = []
for d_idx in range(len(data)):                            # 고도에 데이터값을 더해서 적정 위치에 그려주도록 함
    dd = [altitude[d_idx] + (i*5) for i in data[d_idx]]
    plt_data.append(dd)

fig = plt.figure(figsize=(14, 14))            # plot 크기 설정
# plt.rcParams['font.family'] = 'NanumGothic'  # 한글 가능하도록 폰트 설정
for idx in range(len(plt_data)):
    plt.plot(plt_data[idx],label='d_'+str(idx))
plt.title("data",fontsize=16)  # 제목 쓰기
plt.legend(loc='right')
plt.yticks(altitude)
plt.grid()
plt.show()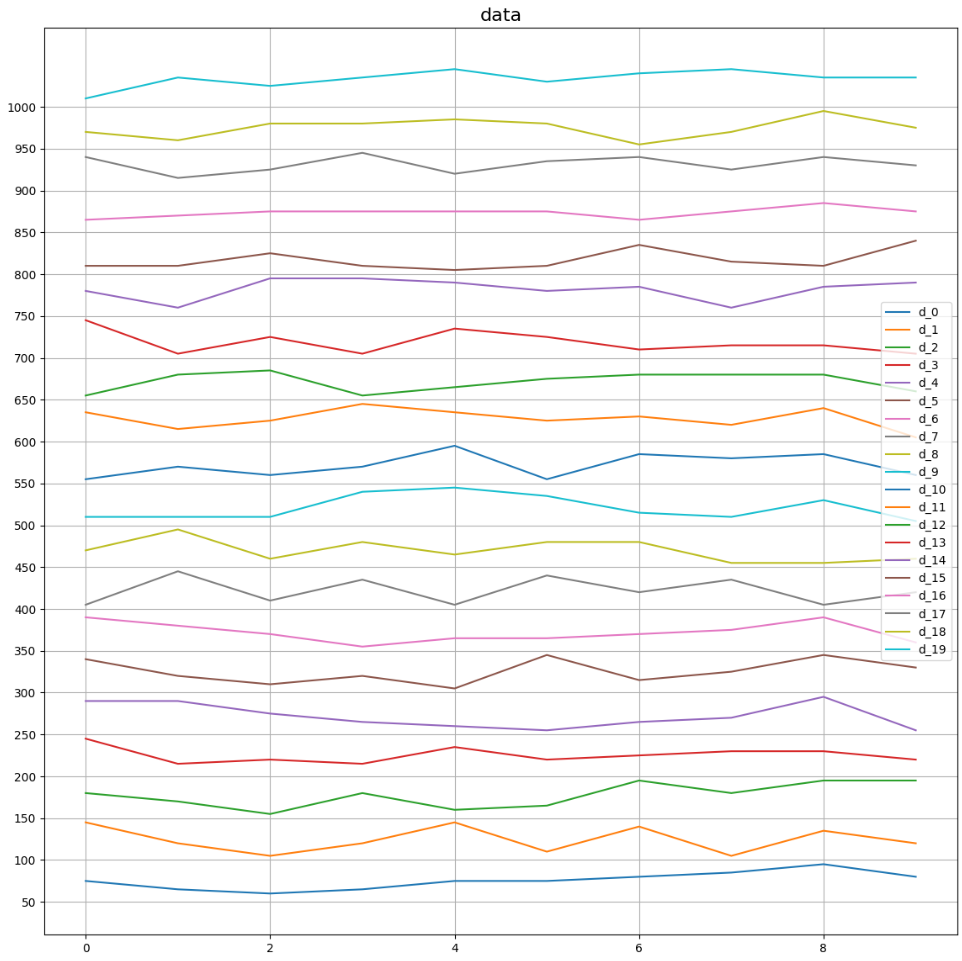
2번째 방법
import random
import matplotlib.pyplot as plt

data = [[random.randint(1,9) for i in range(10)] for i in range(20)]

altitude = [v for v in range(50, 50*(len(data)+1), 50)]  # 고도

fig = plt.figure(figsize=(14, 20))            # plot 크기 설정
# plt.rcParams['font.family'] = 'NanumGothic'  # 한글 가능하도록 폰트 설정
for i in range(len(altitude)-1, -1, -1):
    ax = fig.add_subplot(len(altitude), 1, len(altitude)-i)
    ax.set_ylabel(str(altitude[i]) )
    ax.plot(data[i],label='d_'+str(i-1))
    if i != len(altitude)-1:
        ax.axes.xaxis.set_visible(False)
    else:
        ax.axes.xaxis.set_visible(True)


fig.suptitle('Altitude data')
# plt.tight_layout()
plt.tight_layout(pad=-2)
plt.show()
728x90
반응형